↯
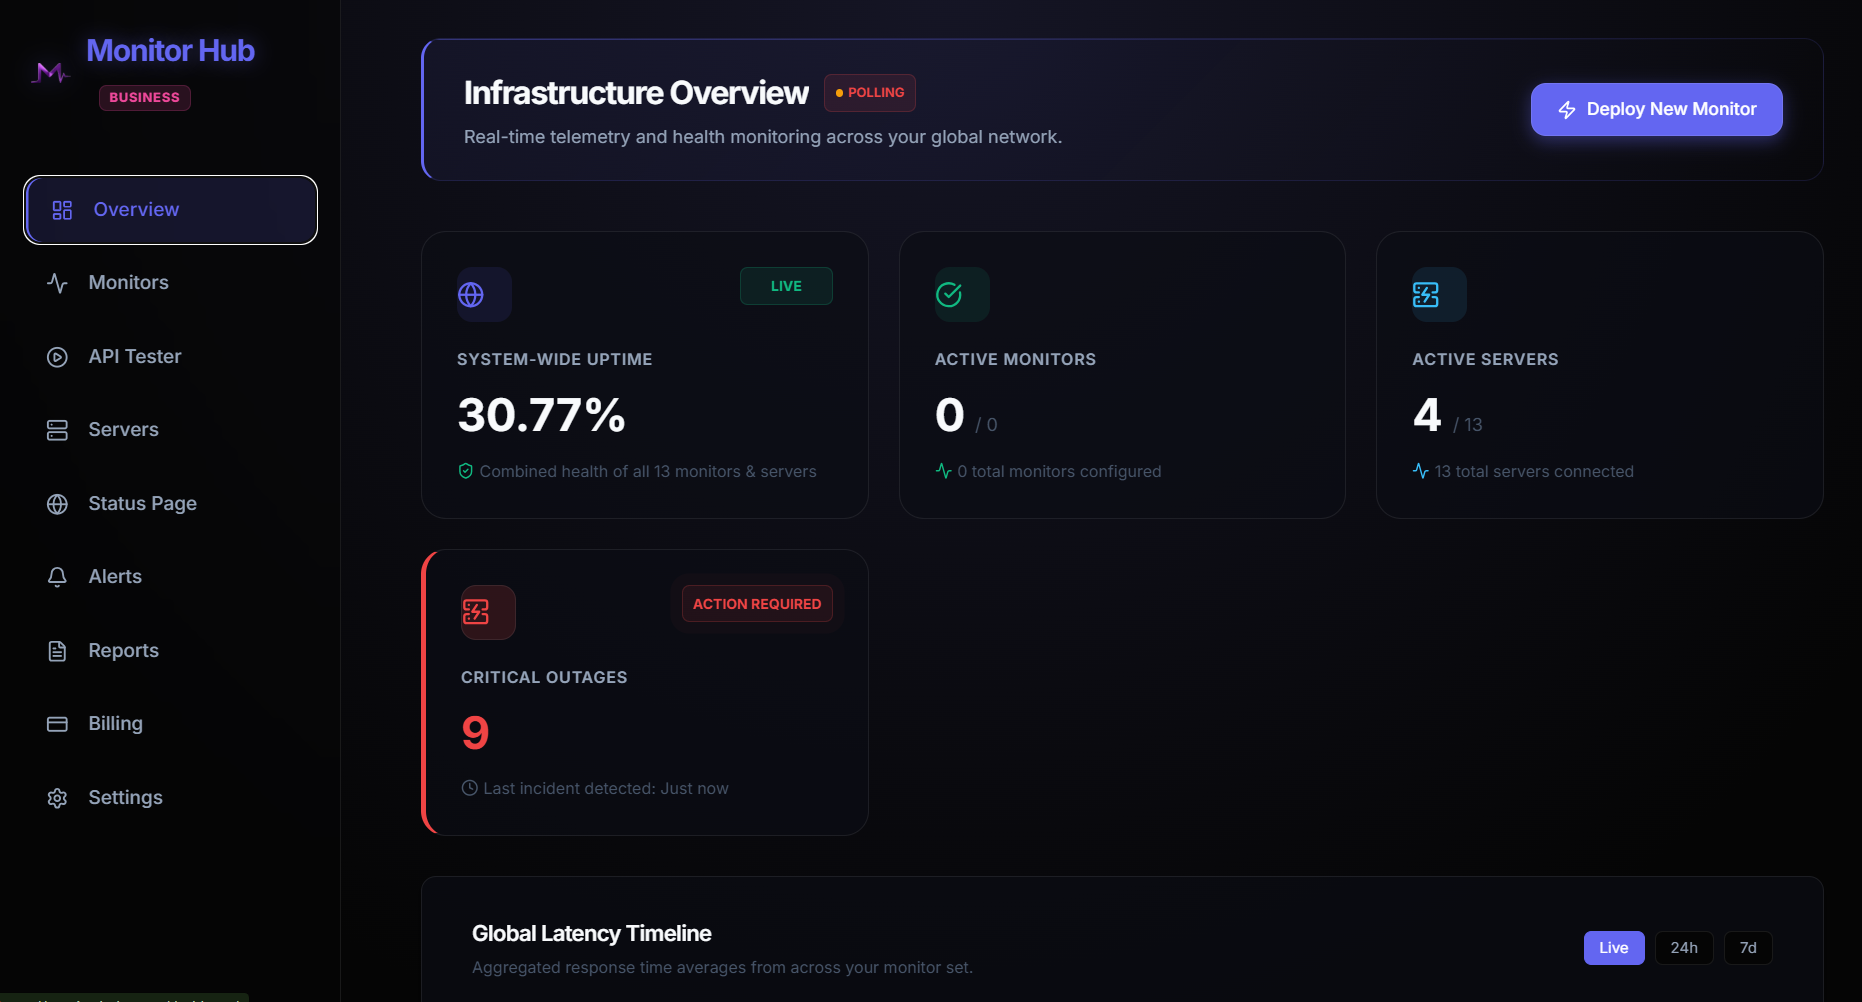
30-second monitoring
Detect downtime quickly with high-frequency checks for production websites and critical services.
Website, API and server monitoring
Ensure 99.99% availability with global checks, deep response validations, and lightweight server telemetry. Zero setup bloat.
Benefits
Detect downtime quickly with high-frequency checks for production websites and critical services.
Confirm incidents from multiple regions before alerting, reducing false positives and panic noise.
Automatic daily SSL checks plus background WHOIS domain expiration warnings at 30, 14, 7, and 1 day remaining.
Send alerts to Slack, Discord, Telegram, Email, webhooks, and recovery workflows.
Go beyond HTTP 200 with deep JSONPath assertions, regex validation, latency thresholds, and custom headers.
Install a native, read-only system service agent (Python/PowerShell) for CPU, RAM, disk, processes, and network.
Public Status Pages
Keep your customers informed during incidents. Create branded status pages in seconds, route traffic seamlessly, and reduce support tickets when things go wrong.
Build Your Status Page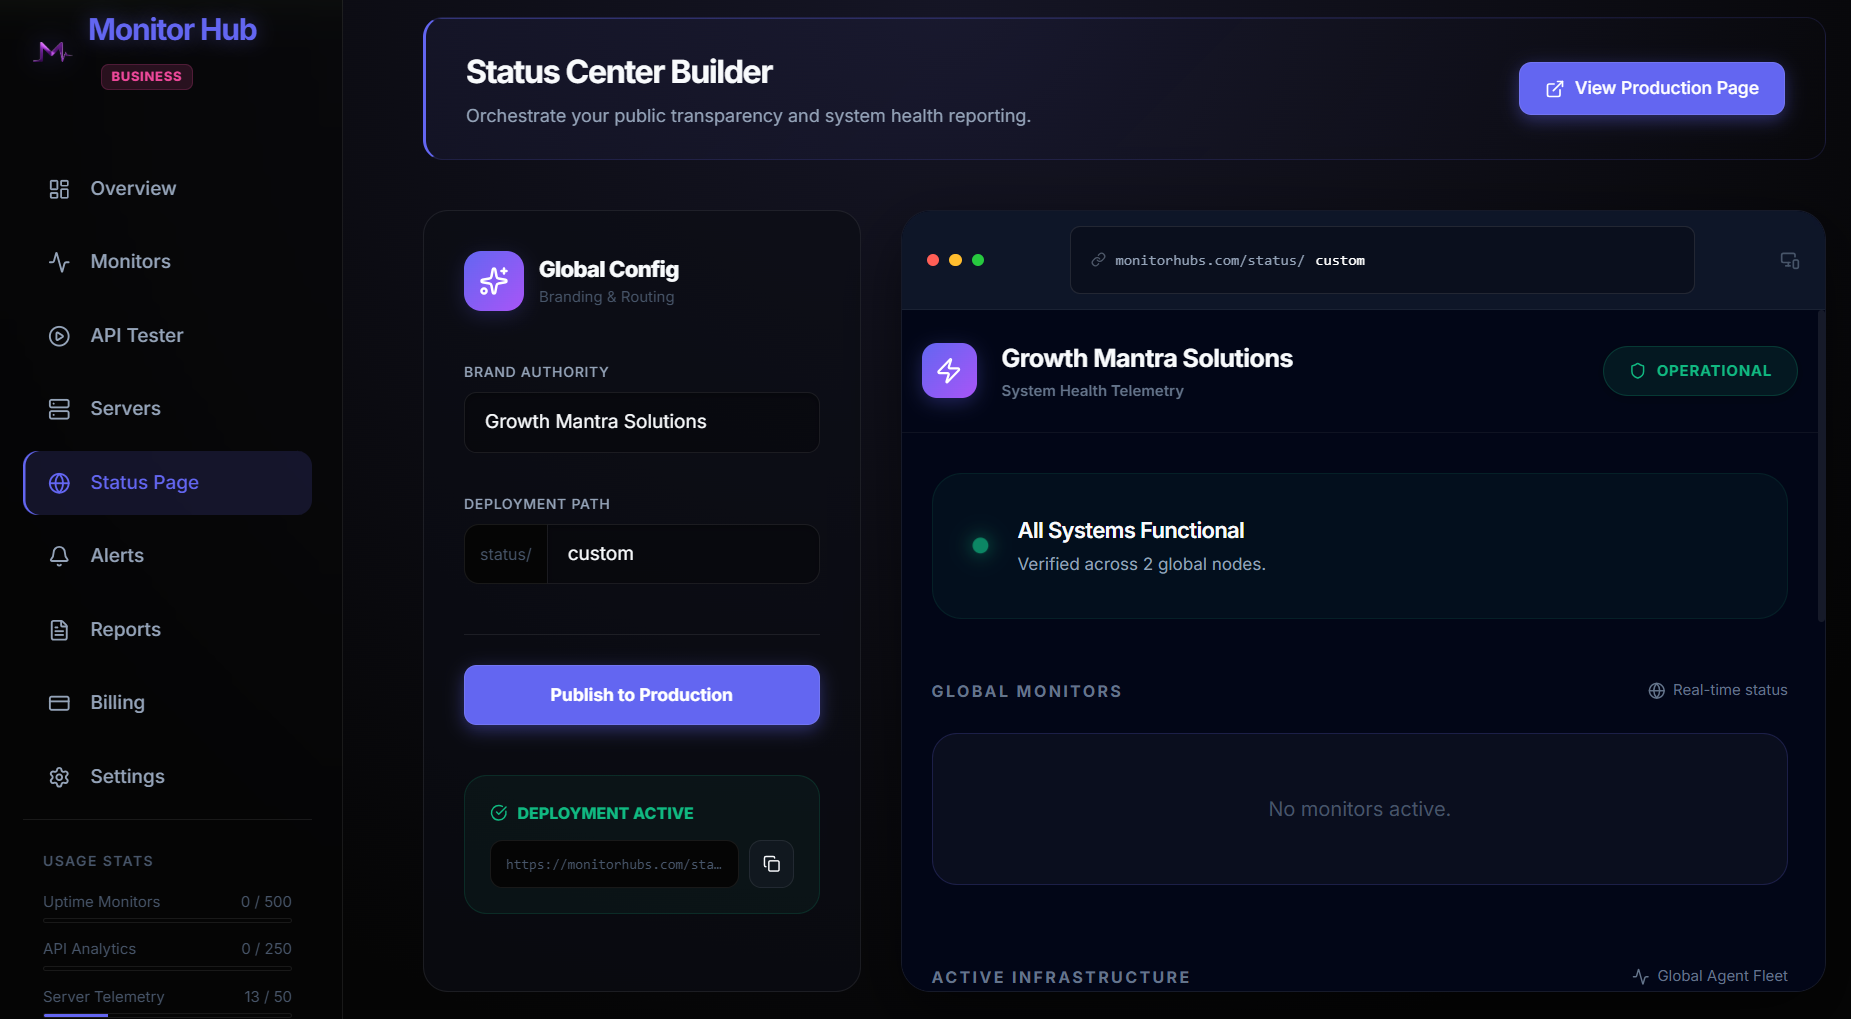
Testimonials
“We switched from Datadog to Monitor Hub and saved 80% on our monitoring bill without losing any critical visibility. The server agent is incredibly lightweight.”
“The API monitoring is the best I've used. Asserting JSON payloads is so intuitive, and the alerts are much faster than our previous setup.”
“Finally, a monitoring tool that doesn't feel like enterprise software from 2005. The UX is beautiful and it just works out of the box.”
Simple pricing
All prices in USD. Cancel anytime.
Perfect for side projects.
Free forever
Grow with confidence.
Billed monthly
Ideal for growing startups.
Billed monthly
For mission-critical ops.
Billed monthly
No credit card needed
Stop guessing. Start getting alerts the moment your website, API, SSL certificate, or server needs attention.
Start Free